top of page

Exploratory Data Analysis
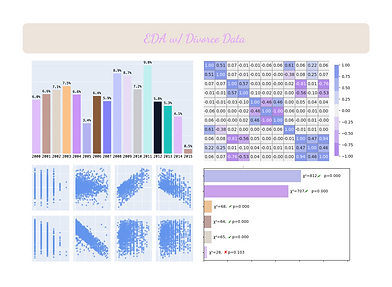
EDA
of Divorce Data
This exploratory data analysis (EDA) inspects a "Divorce" dataset. It explores and visualizes stats (e.g., number of kids, income, marriage duration, etc.) of a set of ~2k couples in Mexico who divorced between 2000 and 2015.
This real-world dataset was obtained from the DataCamp data repository and was explored in a notebook with Python. A Streamlit dash of it also exists in the Visualization Apps section.
Features
Data Cleansing/Structuring
Summary Statistics
Handling Missing Values
Feature Engineering
Bar charts, histograms, boxplots, scatterplots, heatmaps
Correlations, Statistical Tests
matplotlib, seaborn, plotly
Linear Regression

bottom of page